Planning server capacity in environments where demand changes rapidly can be quite challenging. We probably all remember some unpleasant cases where a service behaved rather strangely under load, examples ranging from not being able to log into an online ticket sales system to buy tickets for newly announced tour dates (while thousands of other people trying to do the same thing), food delivery websites getting slow during lunch hours or more serious issues of financial systems grinding to halt with scary out-of-memory and request timeout errors around the of the fiscal year.

These services usually work just fine under “normal” load, however, things get more complicated when they are forced to handle sudden peaks of traffic. In the example of the ticket sales system, servers could handle the load for regular days, but when all of a sudden sales for -insert popular band/singer here- started, the performance of the service degraded quite fast as it was not prepared for scaling up and down its resources in accordance with the shifts in demand.
Similarly, a food delivery service not only needs more delivery personnel on bikes during lunch hours, but also pre-plan server capacity to successfully handle the orders of the flock of hungry customers around noon. On the other hand, to save cost they also might have to consider decreasing capacity and turn servers off during the night. Experience shows that around 4 a.m. there are usually less people interested in having lunch.
Hosting in AWS
Moving web servers and workloads to the cloud gives more flexibility to handle these situations gracefully. With fast provisioning of resources and the support of fully managed monitoring and orchestration tools companies could leverage out-of-the-box solutions for scaling out their resources automatically. Using auto-scaling could result in better user experience as well as potential cost savings by automatically deprovisioning under-utilized resources.
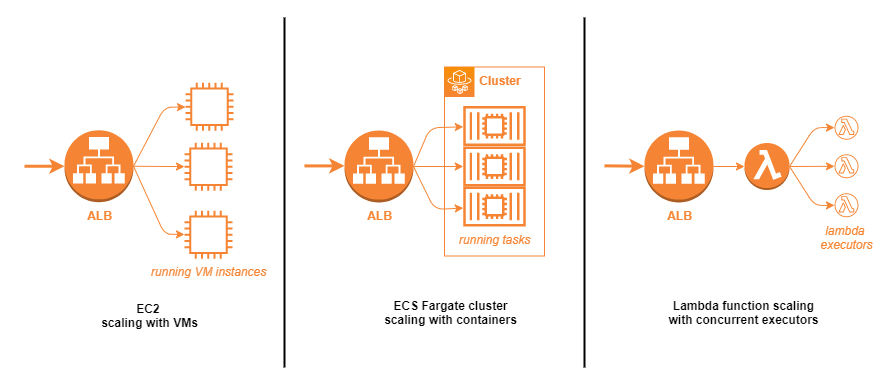
AWS has several hosting options that support auto-scaling. For traditional applications where cloud-native design was not taken into account originally, firing up more virtual machine images with an application load balancer (ALB) for routing incoming traffic could be an option. More modern apps could simply leverage the power of serverless container orchestration (ECS with Fargate) or serverless functions (Lambda) to scale the number of running tasks (~active server instances) or number of concurrent function executors as demand shifts.
Sample use-case
For the sake of demonstrating auto-scaling in practice, let’s imagine that we are tasked with the development and deployment of a food delivery company’s website, called – very imaginatively – “Delivery”. Its front page could look something like this:

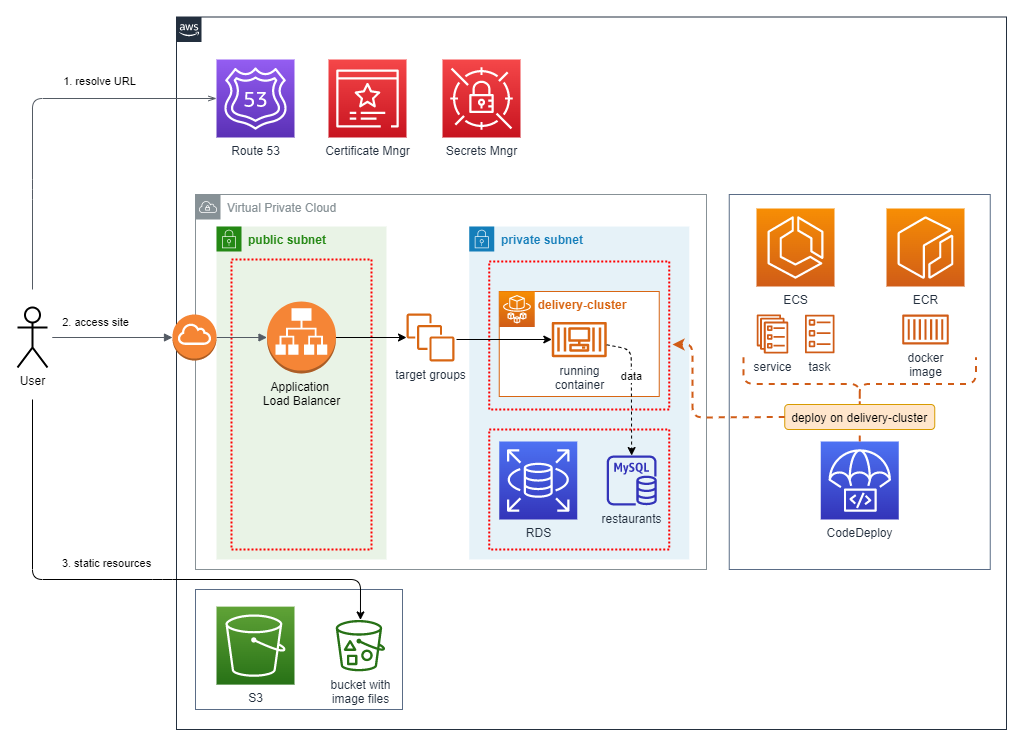
Since this project is for demonstrational purposes only, we could settle on offering limited functionality only, listing mock restaurants and random-generated estimated delivery times. For the implementation we could use Spring Boot with “classic” server-side rendering as its presentation layer, estimated delivery time calculation and JPA database access. The features are all packed into a single Docker container image in Elastic Container Registry and hosted on AWS in serverless mode using Elastic Container Service with Fargate. The underlying data (restaurant list) is stored in a managed MySQL instance in RDS, the thumbnail images of our tasty dishes are hosted on S3 as static resources. The source code of the demo project is available at https://bitbucket.org/andrasberke/delivery/
Usage patterns
For preparing their services to handle peak demand effectively, every company must know how their users interact with their services. There are various solutions for measuring website traffic that can help identify daily, weekly etc. usage patterns, predictable changes in traffic based on past data (see Christmas season for online retail) and YoY growth, all useful metrics for capacity planning.
For the Delivery application demo, we could assume that we have already integrated such service earlier, e.g. by measuring page views with Google Analytics we already established that our daily traffic looks something like this:
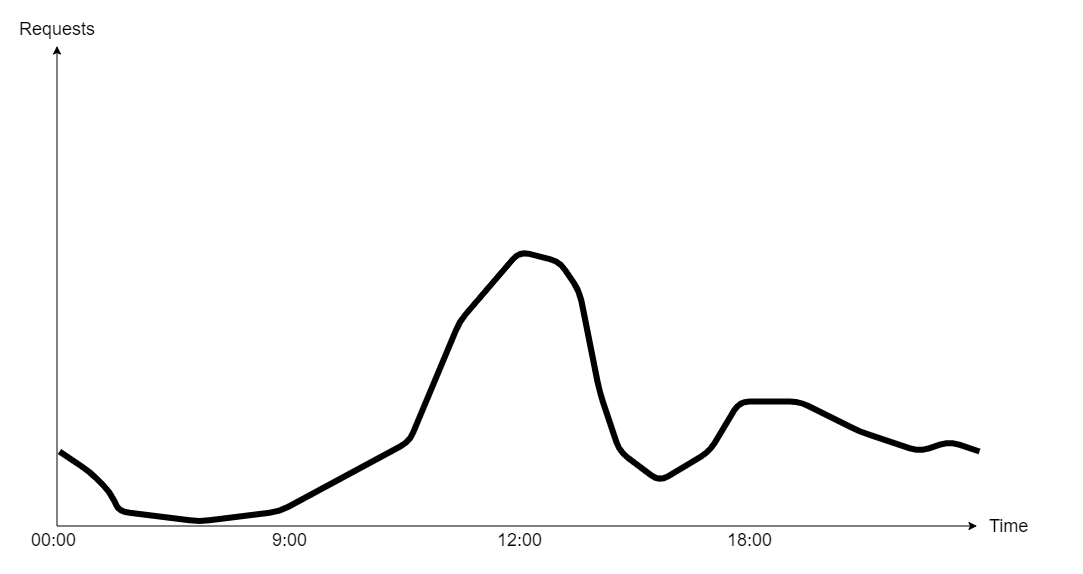
Numbers are growing slowly in the morning until the lunch rush kicks-in around 11:00, making all services and databases (not to mention bike riders) busy, then there is a gap around 15:00, followed by a smaller peak with a long tail in the evening. During the night the service is scarcely used, resulting in idle machines if no action is taken.
Stress testing our service
We could choose from several options to simulate traffic patterns and see how an application behaves under the rising and falling demand that we observe in the analytics data. For example, we could pick an already existing SaaS testing solution like k6.io, LoadForge, etc., quickly set up a test plan with a few (or a few hundred thousand) virtual users and start testing.
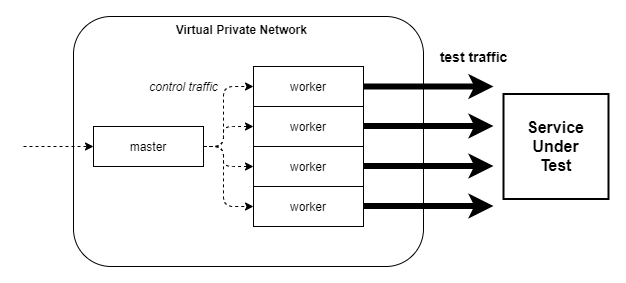
Another option is to use JMeter, one of the most popular open source load testing tools available, and host it on our own network in distributed mode. By adding more machines as worker nodes (and possibly also spread them across various physical locations), we could create traffic that somewhat behaves like a group of real users accessing the service at the same time.
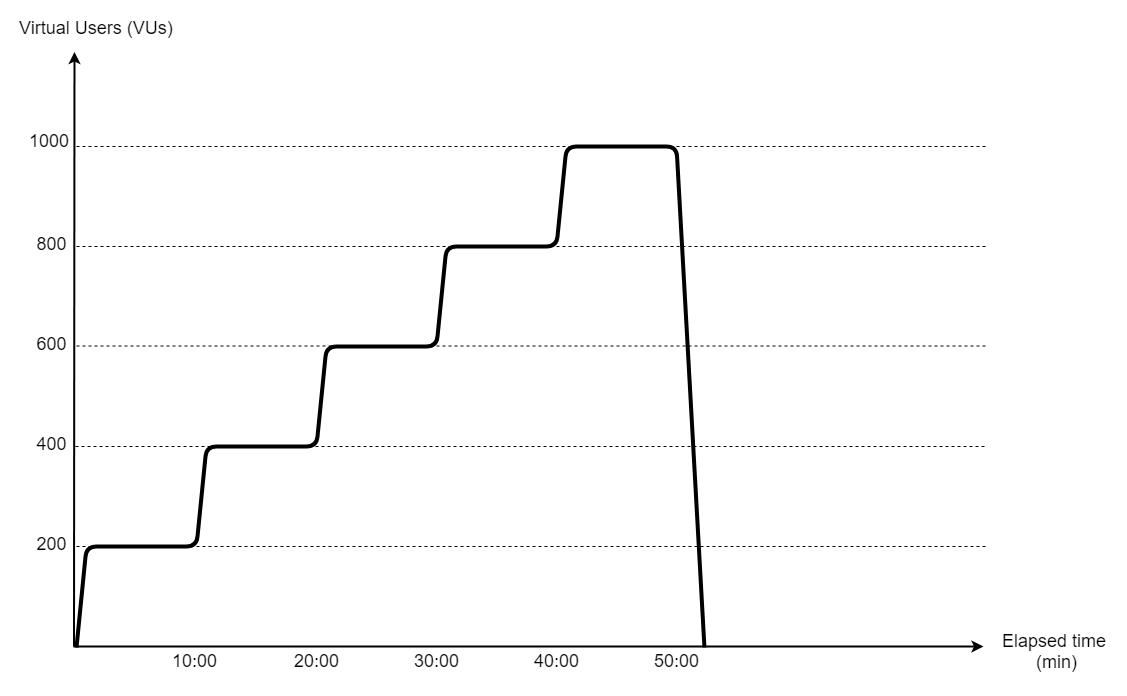
However, before bombarding our WIP service with 100k/s parallel requests for stress testing, it is worth doing some smaller-scale experiments, e.g. setup one instance of JMeter and start with a couple of hundred users while hosting the service using a modest initial resource pool to check how it behaves under pressure. For simulating the growing load on the Delivery application, we could use a plugin called “Ultimate Thread Group” which offers finer control over the number of VUs (virtual users, effectively threads) used for the duration of the load test.
We can create for example the pattern shown below, having some resemblance with the increasing load we see between 11:00 and 12:00, when the lunch-rush kicks in. We start with 200 VUs doing around 2000 requests/min, a volume that the Delivery service configured with small resources (0.5 virtual CPU and 1 GB memory) and default Spring Boot and Tomcat settings should handle with no problems whatsoever. Then gradually increase the load to 1000 VUs, adding 200 extra users every 10 minutes.
While running this load test pattern without any auto-scaling configured, using only the initially provided moderate resource pool, we will see the same problems as the aforementioned real systems, being incapable of handling high demand that we would encounter.
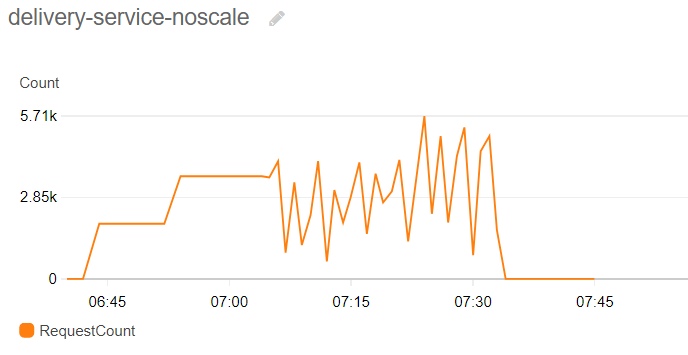
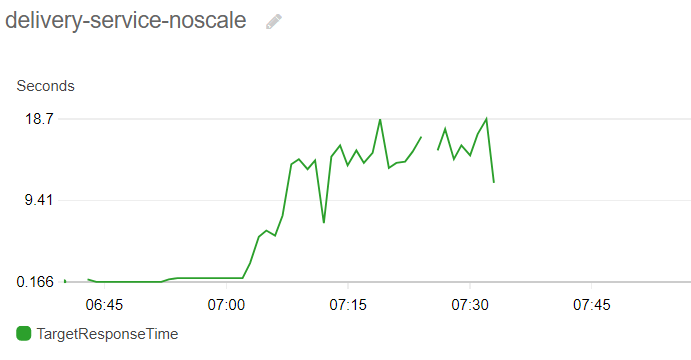
As the number of users interacting with the site grows, response times go up significantly (18 sec), resulting in terrible user experience and in many cases time-outs when submitting orders, our company ending up with hungry (and possibly angry) customers. At a certain point most requests – including health checks – will start returning timeouts, resulting in the service being declared unhealthy by the orchestration system and restarted in an attempt to revive it, which only makes things worse in this case as the site will be completely down during the restart phase, making the plot of handled requests being widely erratic on the diagram above.
Leveraging auto-scaling feature of Fargate
One obvious way out from this situation is to simply overprovision resources either with vertical and horizontal scaling or – to save costs – manually manage instances under the growing load by launching and terminating instances in peak hours and keep reconfiguring load balancers accordingly.
However, what cloud providers recommend instead is to rely on a more flexible approach leveraging their managed resource provisioning, monitoring and orchestration tools and setting up auto-scaling policies to fully automate this flow, advocating it as a low-cost and definitely less error prone alternative due to the elimination of all manual actions necessary. Let’s do an experiment with that for the Delivery service using the serverless hosting and scaling options that AWS Elastic Container Service (ECS) with Fargate offers.
We could still start with the originally provisioned moderate set of resources to handle traffic during low-demand hours, but define additional instructions for provisioning extra computing power automatically. AWS has several options to set up these scaling rules. If we already know our traffic patterns well, we could use schedule-based scaling, simply configuring recurring events triggering ECS to run X more instances between 11:00 and 14:00 regardless of any changes in the actual incoming traffic. This approach has its drawbacks of course if the real traffic differs from the expected so we still might have to overprovision a bit, but it is a good start nonetheless.
However, if we want to be more agile instead of pre-emptively configuring resource pool changes in advance, we could choose metrics-based scaling, in which case the orchestration system is actively monitoring some measurements of the execution environment and reacting to it by starting or stopping instances and reconfiguring the load balancer’s target group accordingly.
The two main categories for this approach are:
a) Target metrics, defining rules like “Keep average CPU usage of a single task around x %, starting / stopping tasks if necessary.”
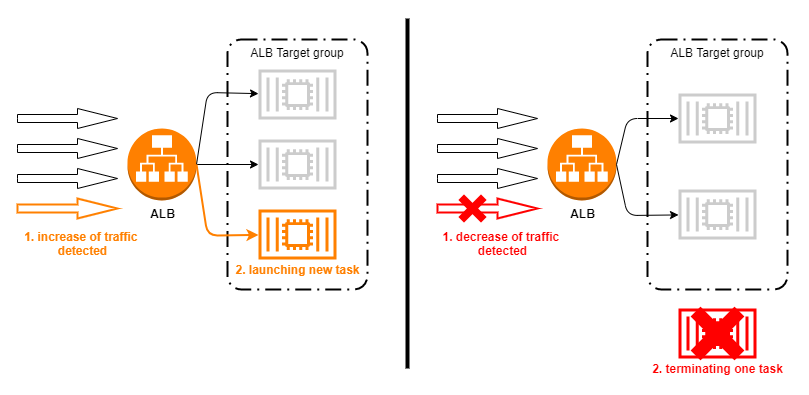
b) Step scaling, defining rules like:
“If the number of incoming requests per target task gets too high (>=X), launch a new task.”
“Conversely, if the number of incoming requests per target gets too low (<=Y), terminate one task.”
Load test with auto-scaling policy
To see the effects of the auto-scaling policies on server performance and resource allocations, we can redeploy the Delivery project with an updated service definition, allowing the ECS orchestration to change the number of running tasks based on the events generated by the AWS monitoring system (CloudWatch), in response to our increasing artificial test load.
In terms of trigger events for scaling, CloudWatch offers various options. For the current experiment, one obvious choice of metric is number of requests per load balancer target, which corresponds to a single running task of the Delivery service in this case. Since we expect that number to increase significantly as our artificial load starts to spike, we want to see the service reacting to that by firing up new tasks, effectively keeping the number of requests per instance at the level that they can comfortably handle.
In the previous experiment without any scaling we saw that the service with the provisioned small set of resources is very capable of handling around 2000 requests/min, which seems like a safe choice for the step scaling as well, however, just to be on the safe side and react to a possible spike a bit more preemptively, we can set it up at 1500, and instruct ECS to handle an increase by starting one additional task. The definition of the scaling policy is shown below.
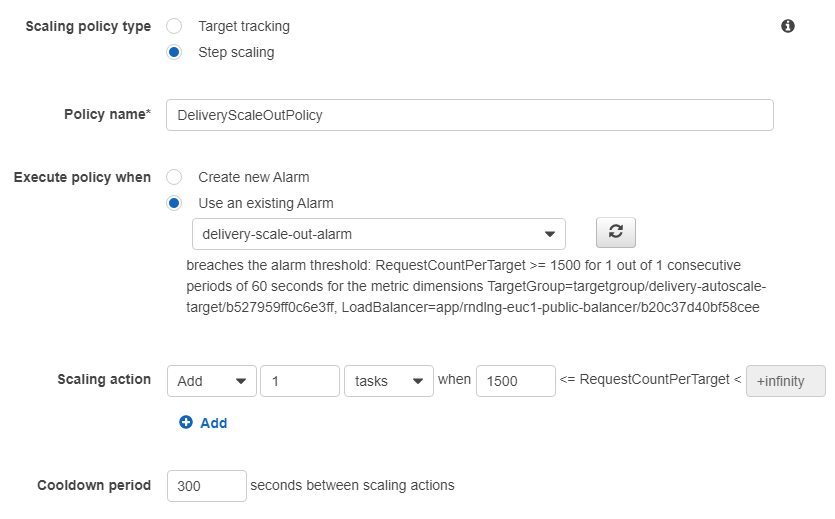
One other important setting to mention is the cooldown period, which instructs ECS not to change the number of instances for a certain period after an auto-scaling event to avoid too frequent and unnecessary changes (e.g. when traffic fluctuates around 1200-1800 requests per target without any further growth).
After applying these settings and starting the service again with the initial set of one running task, we can start the JMeter load test again and observe how the system reacts to the steps of the gradually increasing test traffic. If we look at the chart of the RequestCount and (RC) RequestCountPerTarget (RCPT) metric for example, we will see a much different pattern than previously:
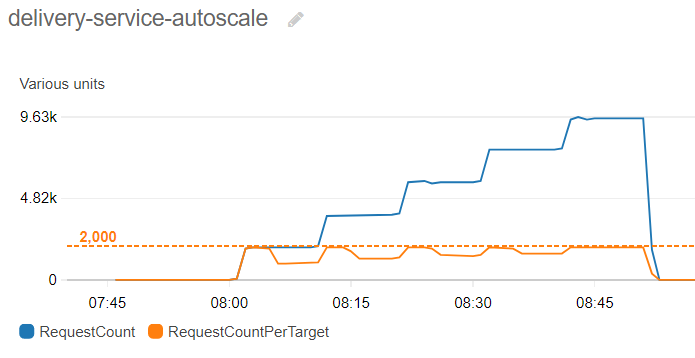
When the test load reaches the first plateau (2000 req/min), ECS responds by adding a new task of Delivery, effectively halving RCPT – now two instances will handle the total load of 2000 req/min, sharing the traffic evenly around 1000-1000 requests thanks to the load balancer’s scheduling algorithm. The next scaling event happens at the next increase (4000 req/min), which will trigger the alarm once more, starting a third instance, decreasing the load handled by a single instance again.
By the end of the gradual traffic increase, we will have 5 active tasks, each of them responsible for handling 1/5th of the peak load of 10k requests/min, running smoothly and processing all incoming requests without any errors or timeouts at the level of 2000 requests/min for a single task.
Looking at the average response times is also more pleasing to the eye as it was in the previous experiment:
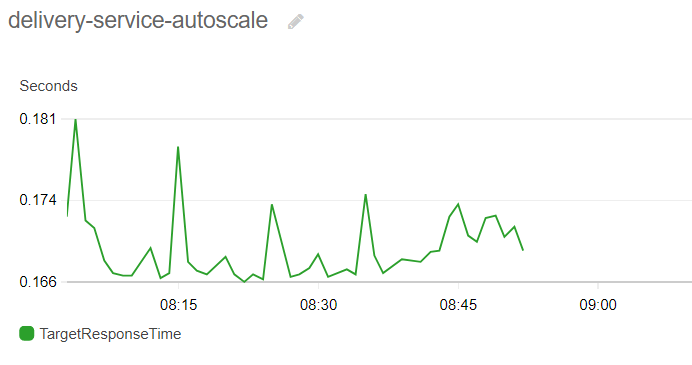
The measured average values stay well under 200 ms for the whole duration of the test, no timeouts recorded in the logs, every test request is handled by the service just as our virtual clients expect.
After setting up the appropriate monitoring and orchestration options, now we have happy customers – as long as the real word also scales with the service of course, restaurants cooking more pizza, frying more Schnitzel and friendly delivery personnel on bikes delivering those to our clientele.
Remarks
- Naturally, there is an other important scenario that we have to test and configure, namely the case of decreasing demand. After diner time and late night pizza orders are over and traffic falls to minimum level, server capacity should be automatically scaled down to save costs. This can be achieved by setting up the exact mirror of the presented scale out policy, where instead of starting instances as demand grows we instruct ECS to shut down tasks as the number of incoming requests or resource utilization falls below a certain threshold.
- Capacity planning for our services is rather important to optimize cost, responsiveness and reliability of the service. We have to choose the right initial resource pool and configure the auto-scaling rules based on the real traffic that we expect and keep adjusting parameters based on the values we observe. Other performance optimization options like configuring thread pools, database connection pools, caches etc. could be also utilized for maximizing performance.
- Last but not least we always have to ask ourselves whether the tool we choose is a right fit for our use-case. Scaling server resources is not different. Depending on the type of workload, functional and non-functional requirements the optimal solution for resource management might vary. Auto-scaling with serverless Fargate tasks is highly recommended though when serving fluctuating demand of our customers reliably, with hassle-free configuration and with reduced costs is a key goal for the project.
