Showcasing the distributed tracing and topology discovery features of Dynatrace – using a super cool 1990s style website backed by 2010s microservice architecture.
AnimalWeb
AnimalWeb is a demo project that tries to imitate how websites looked like in the glorious days of 1990s, but more importantly, it is built on a simple microservice architecture to be able to showcase the distributed tracing and topology mapping features of Dynatrace, the popular software intelligence platform.
Project setup

The full deployment of the project consists of:
- AnimalWeb: A Tomcat web server responding to the incoming public HTTP requests and rendering the AnimalWeb home page.
- CatService, DogService: Java Spring-based services responsible for managing our two main data domains, exposing cat and dog entities for the web server via an internal REST API.
- catdb, dogdb: Underlying data storage for the cat and dog entities, MySQL databases.
Since our goal is to test distributed tracing, the services and the web server are hosted on different VM nodes on Amazon EC2 and communicate via private DNS. The storage containers are two AWS-managed MySQL databases in RDS.
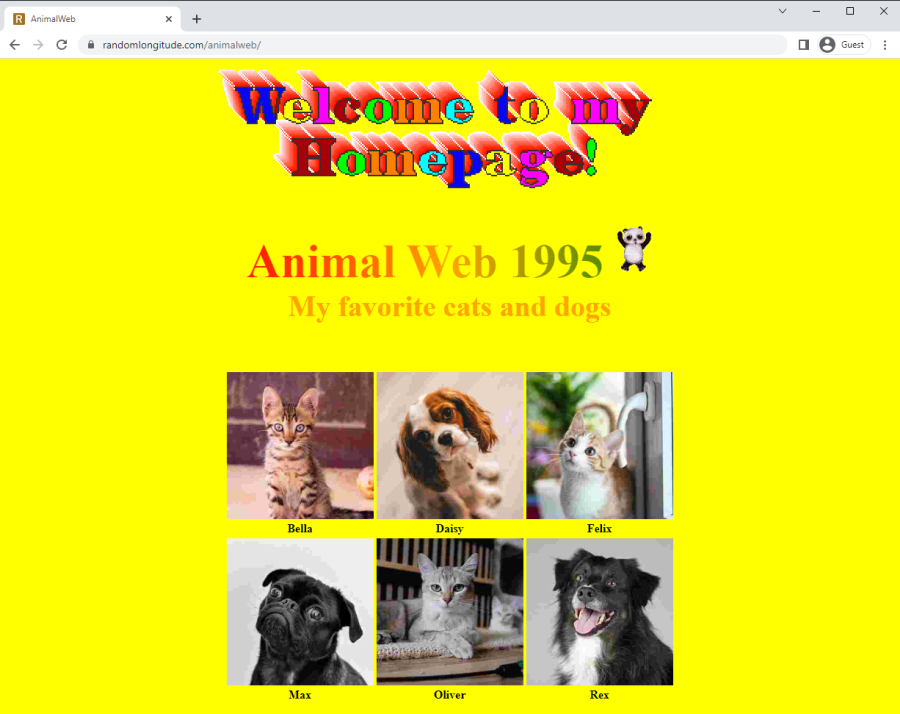
For every incoming request the web server queries CatService and DogService via their REST APIs to collect all entries to be displayed, then combines and transforms the results to HTML using “classic” template-based server-side rendering.

Monitoring with Dynatrace
The monitoring technology of Dynatrace is based on OneAgent, a set of auto-configured services running on all the observed nodes and collecting a wide range of data including performance metrics of the hosts, running processes, logs, HTTP requests as well as detailed metrics for certain tech stacks like Java applications.
All collected data is forwarded to and processed by Dynatrace, providing real-time telemetry data and insights about the whole application stack as well as its individual components
As a quick setup for the showcase, OneAgent can be installed on our Linux nodes by executing the installer script on all the machines to configure the necessary user, rights and service policies to start monitoring immediately.
Topology discovery
One of the core features of the platform is topology discovery, which helps to map out all components and dependencies of even the most complex applications in a distributed computing environment. All these connections can be visualized through directed graphs for further inspection by the users.
After enabling OneAgent for AnimalWeb and sending a warm-up HTTP request to the web server, the mapping is available almost immediately, visualizing the mapped topology that is consistent with the project setup described in the section above.

Although AnimalWeb is a rather small project with a few connections that can be just as easily drawn by hand, imagine how useful this automatic mapping could be in a more complex, real-word scenario, where creating and maintaining a live documentation of the system architecture is nearly impossible due to the level of complexity and the frequency of changes.
Distributed traces
While topology mapping can be useful for gaining insights on how the various components of system architecture work together, being able to track individual requests across services and databases is even more crucial in highly distributed and constantly changing systems.
Following an incoming client request while it propagates through the whole system can help tremendously to identify performance bottlenecks, misconfigured services, faulty deployments, not to mention troubleshooting mysterious, hard-to-reproduce but critical errors reported by important customers.
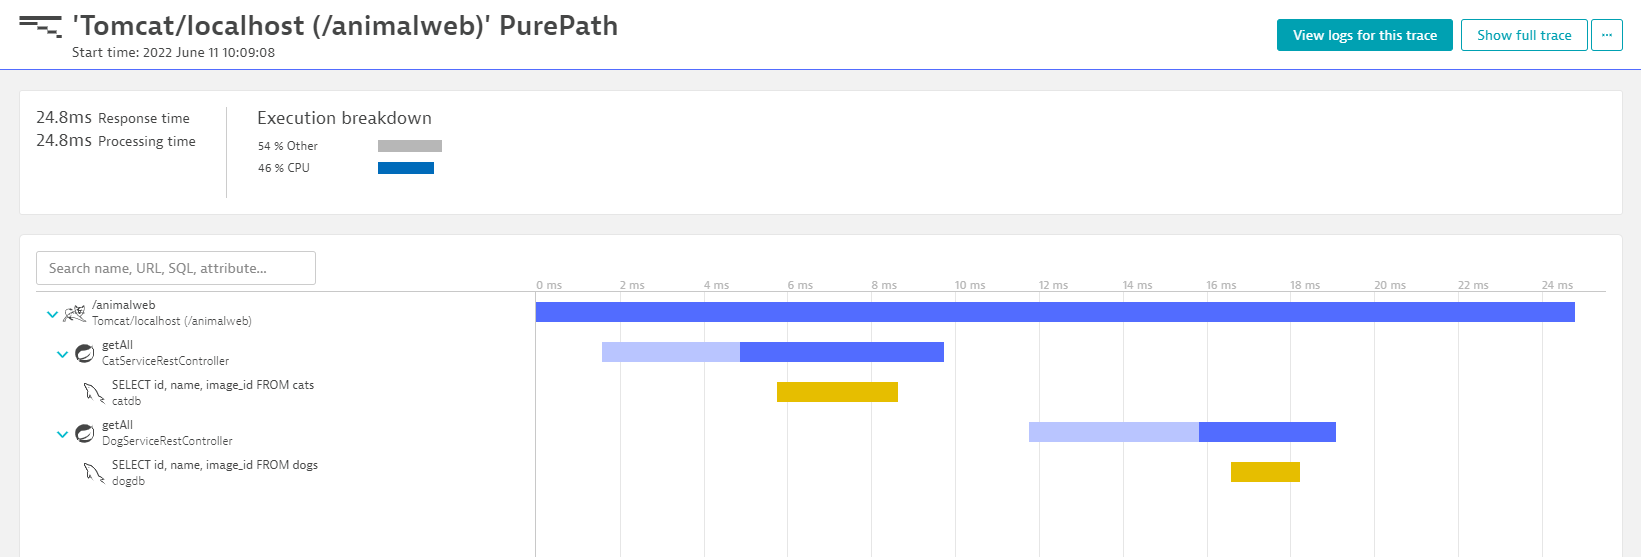
After installing OneAgent on all nodes of the AnimalWeb deployment, distributed tracing with Dynatrace works out-of-the-box, individual call data is saved and transformed into call chains visualized on the Dynatrace website as distributed trace (PurePath) data.
Leveraging the data collected on the host machines we can observe each and every incoming request starting with the frontend call and going downstream to the level of the actual SQL queries hitting the databases.
Similar to the topology graph, the traces can be also visualized in the so called service-flow view, providing insights on how the individual nodes work together to serve the incoming requests:

Detecting failures
To experiment a bit more with the distributed traces we can observe what would happen if one of the services started to misbehave, either:
- quits unexpectedly (e.g. due an error like OutOfMemoryError crashing the JVM)
- starts sending error responses (e.g. due to an application bug in the latest deployed version)
Unreachable service
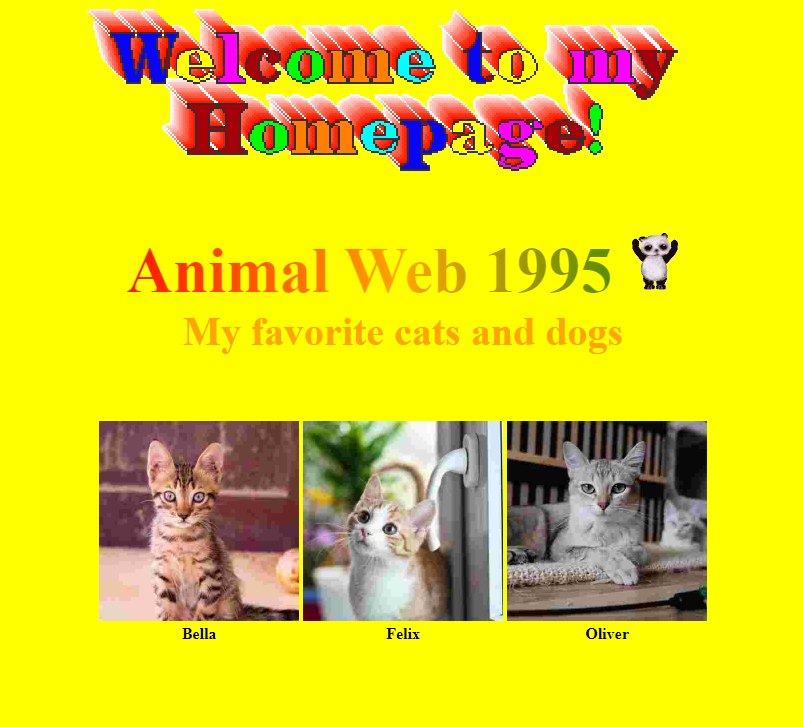
Let’s say that in the AnimalWeb deployment DogService is down. We can easily simulate this by terminating the process manually. The system is designed with fault-tolerance in mind, so rendering of the homepage will not fail, however, the final results will only contain entries from the still running CatService:
The failure of the service is reported by the Dynatrace OneAgent, so the error also shows up on the PurePath data, making the process of identifying faulty parts of the distributed system rather easy:
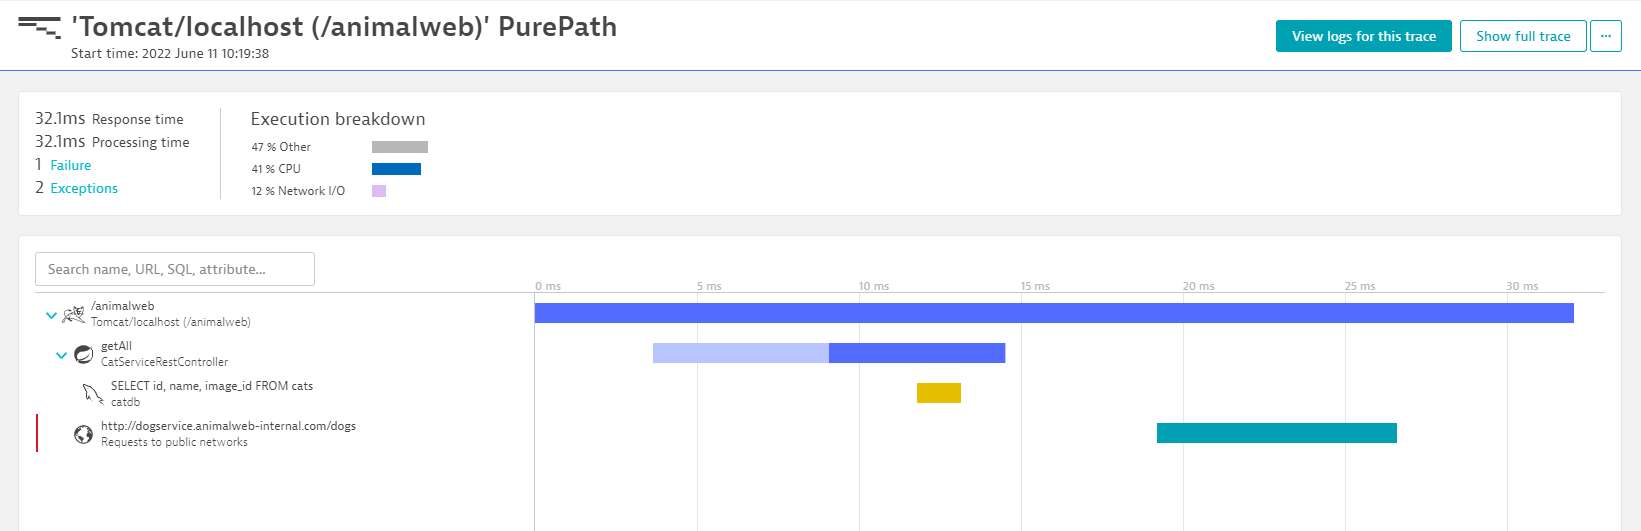
Selecting the faulty segment of the trace also gives detailed information about the failure, hinting that the service might be down, based on the ‘502 Bad Gateway’ response:
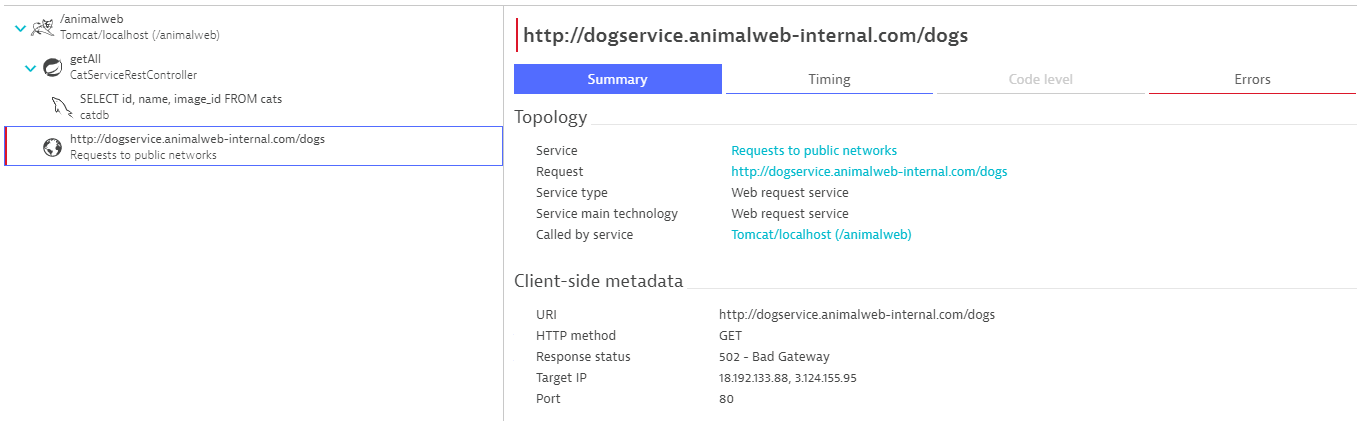
(Note that the call to the DogService shows up as “public” since the EC2 hosts running the demo have public IP addresses as well for easy SSH access. In a prod environment these would be strictly private resources with VPC-only access).
Misbehaving service
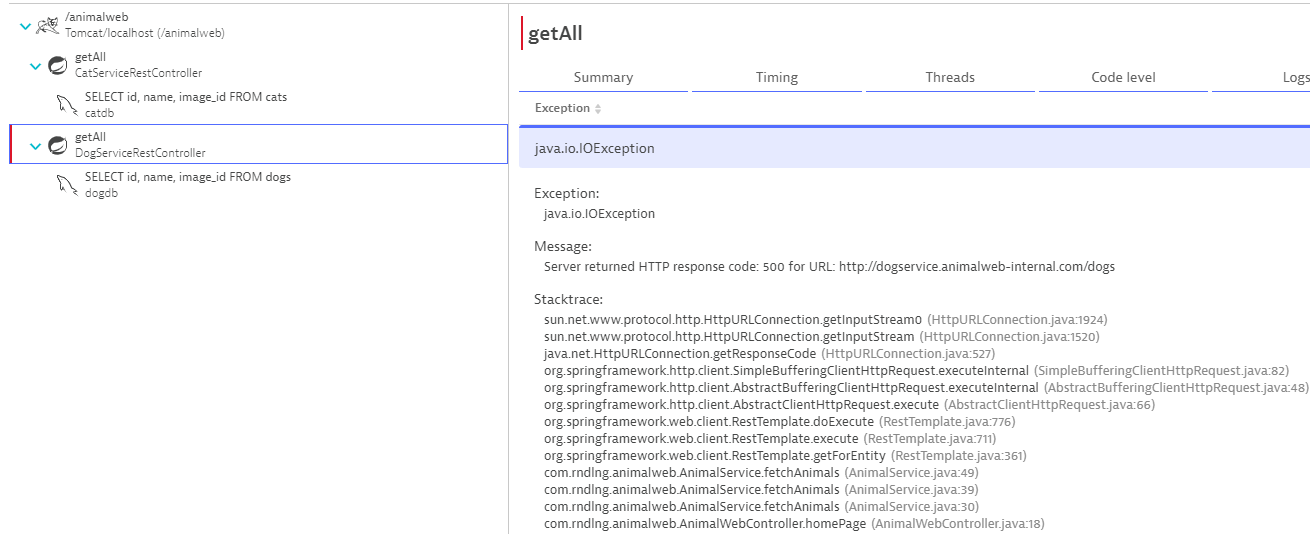
In the second scenario where our goal is to simulate application bugs, we can modify DogService to throw an exception when requesting dog entries, resulting in ‘500 Internal Server Error’ instead of the expected ‘200 OK’ response.
Dynatrace will also mark these error responses on the PurePath data and attach the available Java stack traces to help troubleshooting the (simulated) application bug:
Exception on the call site (AnimalWeb):
Root cause is a RuntimeException in DogService:
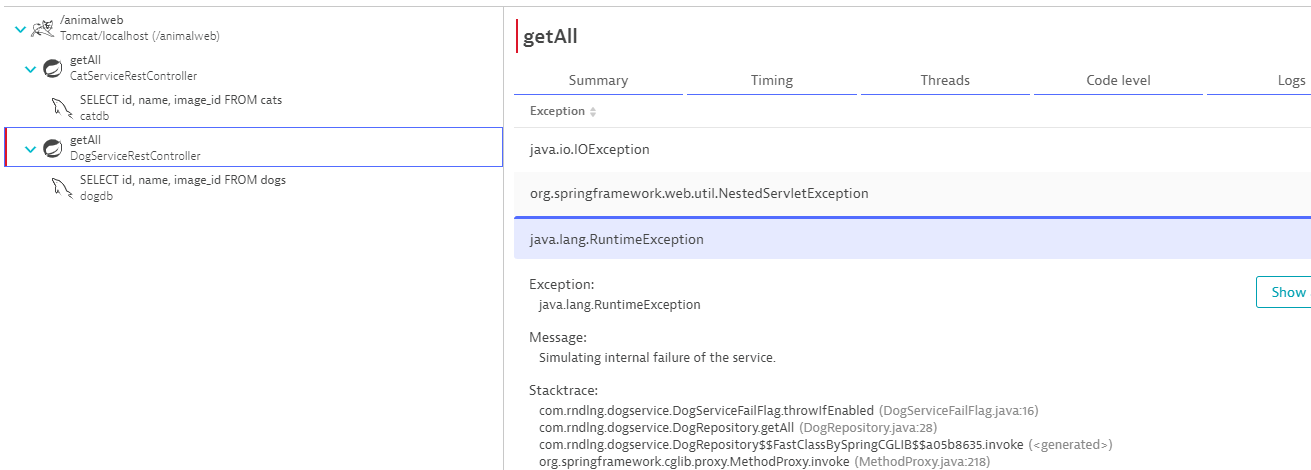
Notice that the PurePath data shows that the call to the db still goes through, since we throw the exception after requesting the data from the dogdb instance.
Using the distributed tracing feature considerably simplifies the process of identifying faulty parts and narrowing down the search for possible root causes, especially if we have a more realistic example with a lot more moving parts, where figuring out the potential sources of failures are not as obvious as in the simple AnimalWeb project.
Further topics
In this short demonstration we are only scratching the surface of what can be achieved in the topic of Observability while using the Dynatrace platform. We could experiment with more complex sample project setups, monitoring AWS infrastructure, deploying to hybrid cloud, Kubernetes, serverless hosting, optimizing for fault-tolerance, leveraging automatic root cause analysis, log monitoring, vulnerability detection and many more possibilities for the further development of the AnimalWeb project.
