Evaluating ElasticSearch performance in large datasets, based on a demo use-case of flight departures search
How elastic is ElasticSearch (ES)? To try to get some answers to the question, I put together a small project for flight history search called Depart.
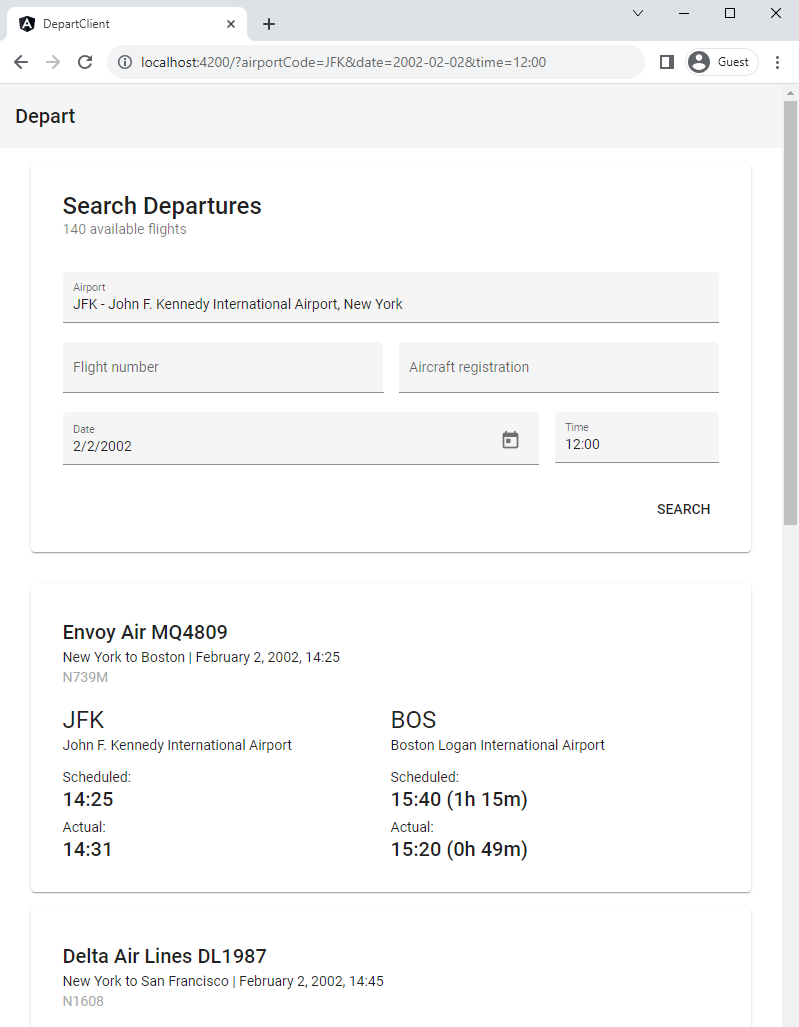
The imaginary users of this application can look for flight departures, search by date, time, airline, aircraft registration to find the flights they are looking for.
Testing the application with millions of records might us give some insights on how ES scales as the size of the indexed data grows.

Photo by John McArthur on Unsplash
Search in Departures
For performance testing I took the Airline On-time Performance Dataset containing 120 million flight records from the US between 1987 and 2008, sampled a smaller subset of the data to experiment with and fed it to an ElasticSearch Cloud cluster. While setting up the dataset, I have defined an index schema where only fields relevant for the use-case are indexed by ES:
{
"mappings" : {
  "properties" : {
    "actualElapsedTime" : { "type" : "long", "index": false },
    "airTime" : { "type" : "long", "index": false },
    "arrDelay" : { "type" : "long", "index": false },
    "arrTime" : { "type" : "long" },
    "cancellationCode" : { "type" : "keyword", "index": false },
    "cancelled" : { "type" : "long", "index": false },
    "carrierDelay" : { "type" : "long", "index": false },
    "crsArrTime" : { "type" : "long" },
    "crsDepTime" : { "type" : "long" },
    "crsElapsedTime" : { "type" : "long", "index": false },
    "dayOfWeek" : { "type" : "long" },
    "dayOfMonth" : { "type" : "long" },
    "depDelay" : { "type" : "long", "index": false },
    "depTime" : { "type" : "long" },
    "dest" : { "type" : "keyword" },
    "distance" : { "type" : "long", "index": false },
    "diverted" : { "type" : "long", "index": false },
    "flightNum" : { "type" : "long" },
    "lateAircraftDelay" : { "type" : "long", "index": false },
    "month" : { "type" : "long" },
    "nasDelay" : { "type" : "long", "index": false },
    "origin" : { "type" : "keyword" },
    "securityDelay" : { "type" : "long", "index": false },
    "tailNum" : { "type" : "keyword" },
    "taxiIn" : { "type" : "long", "index": false },
    "taxiOut" : { "type" : "long", "index": false },
    "uniqueCarrier" : { "type" : "keyword" },
    "weatherDelay" : { "type" : "long", "index": false },
    "year": { "type" : "long" }
  }
}
Sample record in the dataset, a flight leaving John F. Kennedy International at 14:31, 2nd Feb 2002:
{ "actualElapsedTime": 49,"airTime": 35,"arrDelay": -20,"arrTime": 1520,"crsArrTime": 1540,"crsDepTime": 1425,"crsElapsedTime": 75,"cancellationCode": "NA","cancelled": 0,"carrierDelay": 0,"dayOfWeek": 6,"dayOfMonth": 2,"depDelay": 6,"depTime": 1431,"dest": "BOS","distance": 187,"diverted": 0,"flightNum": 4809,"lateAircraftDelay": 0,"month": 2,"nasDelay": 0,"origin": "JFK","securityDelay": 0,"tailNum": "N739M","taxiIn": 5,"taxiOut": 9,"uniqueCarrier": "MQ","weatherDelay": 0,"year": 2002 }
Having the persistence layer only would be a bit boring, so I also implemented a service written in Spring Boot Kotlin, exposing the search functionality as a domain-specific REST API endpoint and enriching the data with a few user-friendly fields including airline and airport names:
HTTP GET /flights?origin=JFK&date=2002-02-02&time=12:00

HTTP 200 OK
{
  "results": [
    {
      "airline": {
        "uniqueCarrierCode": "MQ",
        "name": "Envoy Air"
      },
      "flightNumber": 4809,
      "tailNumber": "N739M",
      "origin": {
        "code": "JFK",
        "name": "John F. Kennedy International Airport",
        "city": "New York"
      },
      "destination": {
        "code": "BOS",
        "name": "Boston Logan International Airport",
        "city": "Boston"
      },
      "date": "2002-02-02",
      "scheduledDeparture": "14:25",
      "actualDeparture": "14:31",
      "scheduledArrival": "15:40",
      "actualArrival": "15:20",
      "scheduledElapsedTime": "PT1H15M",
      "actualElapsedTime": "PT49M",
    },
    { ... }
  ]
}
On top of the service there is a rather minimalistic Angular frontend for supplying query parameters and visualizing search results:
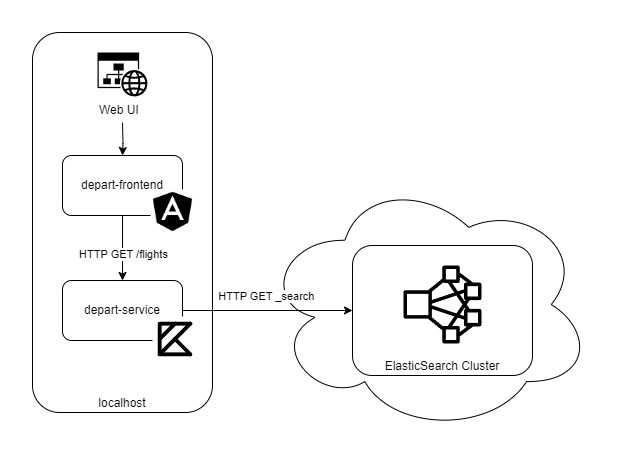
An overview of the implemented components working together:
Test scenario
The setup works pretty nicely with the initial small dataset of a few hunder records, giving excellent response times while clicking around on the frontend, but what if we start adding a significantly larger amount of data?
To plot some performance statistics for the ES index of the Depart application, I have defined the following test sequence:
Clear index

Feed batch of records from 1990-01

Benchmark search requests
  flights?registration=N305A1
  flights?registration={RANDOM}
  flights?origin=ATL&date=1990-01-11&time=11:00
  flights?origin=JFK&date=2020-01-01&time=11:00

Feed batch of records from 1990-02

Benchmark search requests
  flights?registration=N305A1
  flights?registration={RANDOM}
  flights?origin=ATL&date=1990-01-11&time=11:00
  flights?origin=JFK&date=2020-01-01&time=11:00

(... repeated tests from 1990-03 until 2005-12)

Done
The benchmark requests are executed several times to get more accurate median and max response times after inserting each batch. The requests include searching by:
- existing aircraft registration number: to try text search by a single indexed field,
- random aircraft registration number: to skip through any caches,
- existing date and time for a popular airport: to try searching by multiple fields and getting many results,
- non-existent date and time for a popular airport: to try searching by multiple fields with a query that should never yield any results.
Collecting the response times would provide some insights into ES performance while the size of the dataset increases from 100ks of records up to the order of 90 millions, including all flights in the dataset from 1990 to 2005.
The response times are measured at the level of the service API client, so they also include any overhead caused by the extra communication and (de)serialization of data.
Results
After running the batch inserts for all 16 years, I ended up with ca. 90 million flights stored in Elastic.
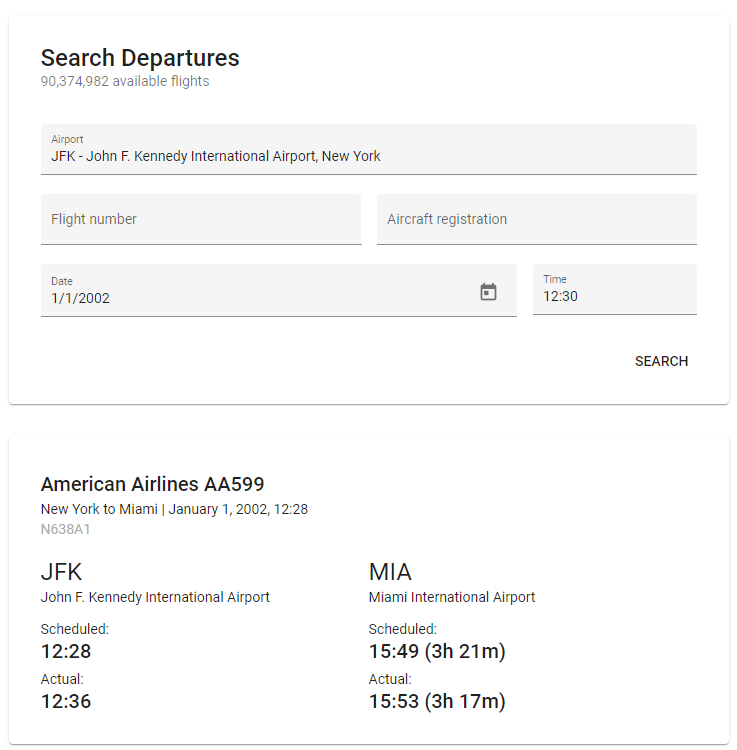
The frontend is still responsive, no perceived negative impact on performance. But what about some quantitative results?
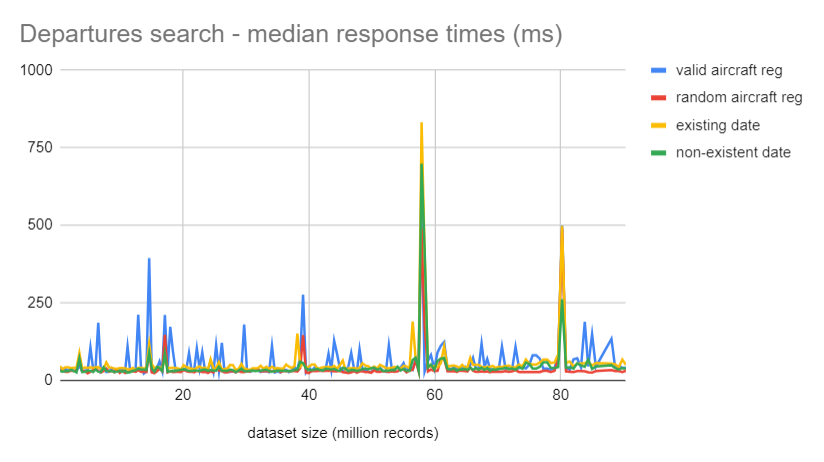
Recorded median response times throughout the test:
Recorded max response times throughout the test:
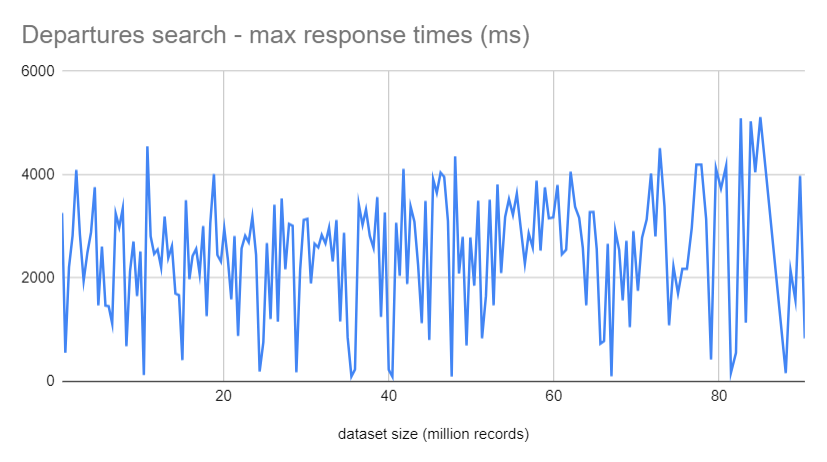
The scalability of the search engine looks rather impressive, median response time for all query types stays basically flat, with a few exceptions when the request is colliding with ES reshuffling partitions after inserting a new batch, and a minor increase after the number of stored records goes beyond 75 millions. Beside those the plotted data does not show any signs of significant performance degradation, no exponential nor linear increase in response times.
Not too bad.
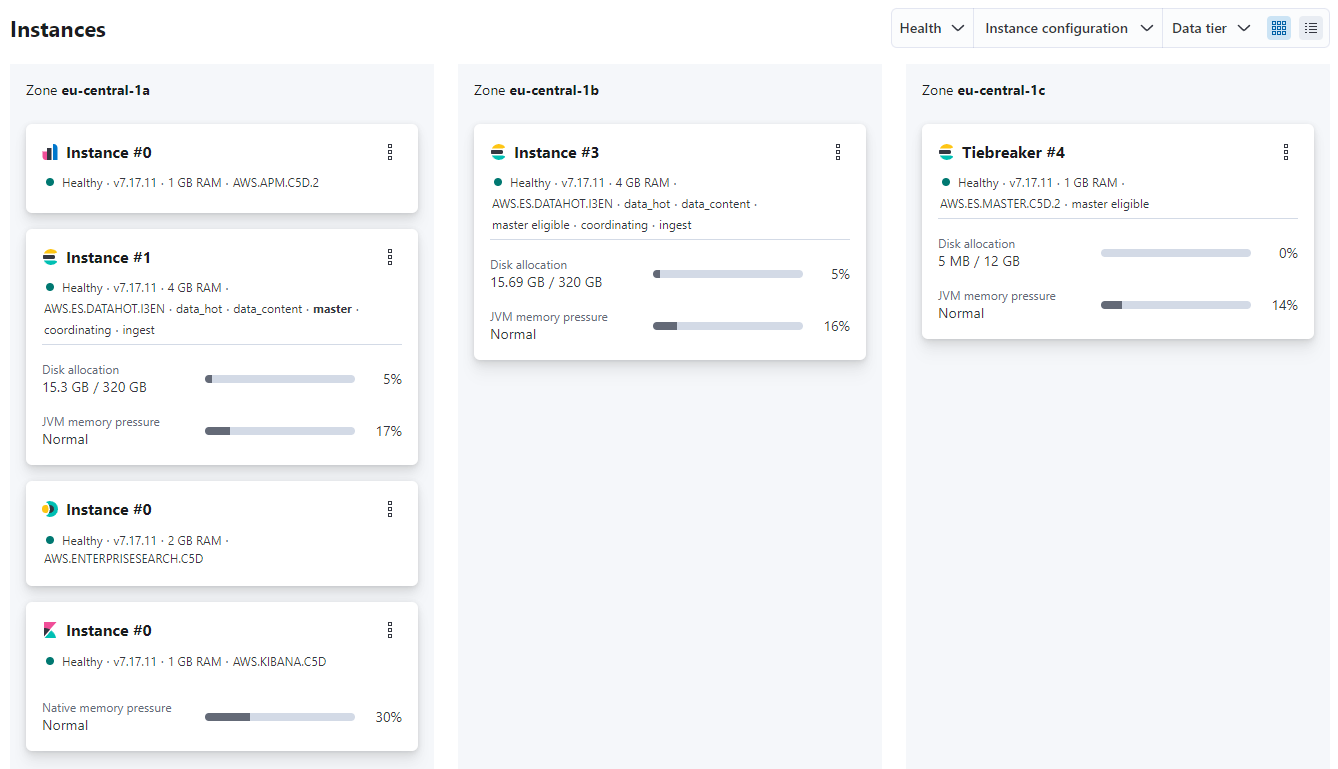
The ES cluster diagnostics after inserting all the data also shows the cost of this awesome query performance: total size of data stored on the instances of the cluster – including all extra index structures generated – is around 31 GB, nearly triple the size of the initial CSV file with all records downloaded from Kaggle.
Further ideas
Some ideas for future work, exploring the topic of performance testing further:
- Testing with an even larger dataset. Although 90 million flight records might seem a lot, ES is designed to handle a lot more data, e.g. searchable loglines in the magnitude of billions. It would be interesting to see how the cluster behaves under such load.
- Testing with more users. The plotted stats were collected by running all queries from a single client, one could also check what happens when scaling out the number of parallel requests.
- Comparing the solution to alternatives, e.g. loading all flights into a good old SQL database and trying to run the same queries. The dataset could be also sharded by year/month and stored on separate instances, which would help keeping queries by date and time fast. Searching by aircraft number would still require searching through the indices of all shards though.
